Understanding Digital 100s Trading
Digital 100s, commonly referred to as binary options, represent a unique and engaging financial instrument that allows traders to speculate on the short-term fluctuations of asset prices. These options have gained substantial popularity due to their straightforward nature, offering clear outcomes: either a fixed monetary gain or loss determined by the position of the asset at expiration. However, excelling in this domain requires more than just luck; successful trading in digital 100s involves mastering technical analysis and adopting a strategic approach more broadly.
Essentials of Technical Analysis
Technical analysis is a cornerstone of trading in digital 100s. It relies on past market data, primarily price and volume, to forecast future price movements. Charts, patterns, and technical indicators form the basis of this predictive analysis. By scrutinizing these elements, traders aim to gain insights into potential market directions, enabling them to execute well-informed trades.
Key Technical Indicators
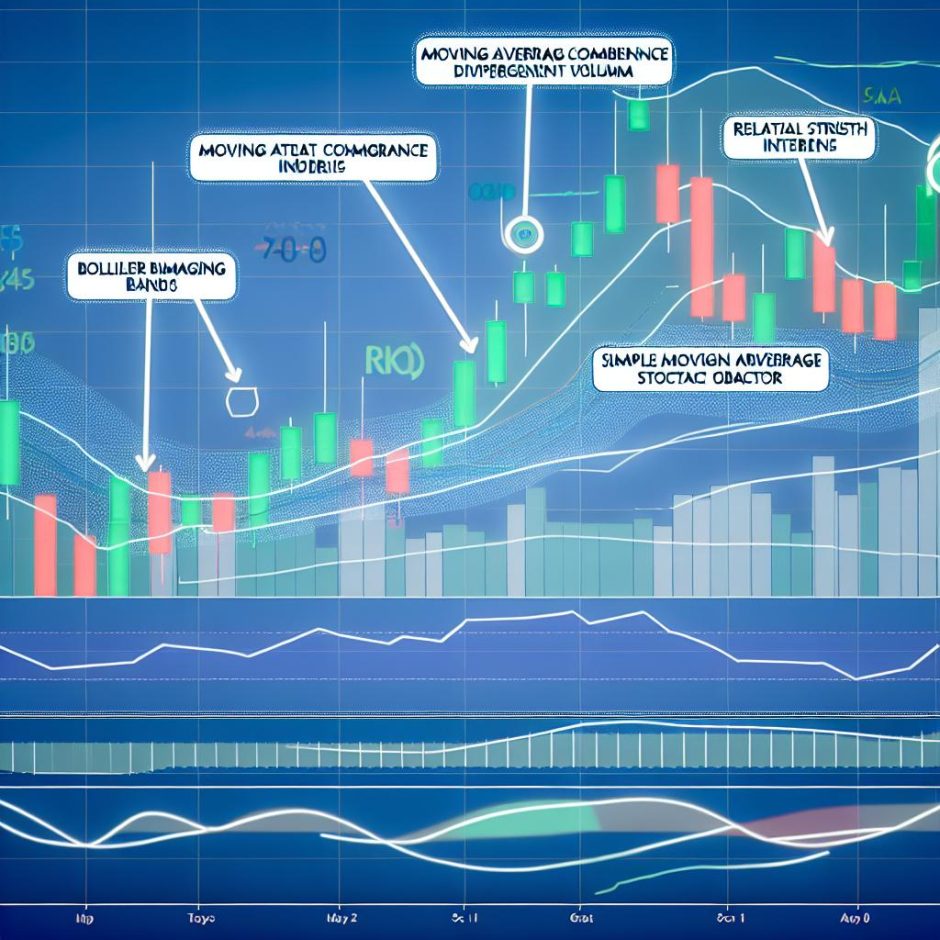
The role of technical indicators is pivotal, providing traders with essential tools to analyze market trends, momentum, and volatility. Let’s delve deeper into some of these indicators, which have proved their efficacy in enhancing decision-making processes and increasing the probability of successful trades.
Moving Average Convergence Divergence (MACD)
The Moving Average Convergence Divergence (MACD) is prominently used among momentum-following indicators. It reveals the relationship between two exponential moving averages (EMAs) of a security’s price. Traders find its simplicity and effectiveness appealing, employing it to identify potential buy or sell signals. The MACD involves three key elements:
- MACD line: This is calculated by subtracting the 26-period EMA from the 12-period EMA. It reflects short-term momentum.
- Signal line: A 9-day EMA of the MACD line. Traders watch for the MACD line crossing this signal line.
- Histogram: The difference between the MACD and the signal line. It visually represents the strength of price momentum.
When the MACD line crosses above the signal line, it suggests bullish momentum, whereas crossing below indicates bearish dynamics. Additionally, centerline crossovers and divergences provide further depth to this indicator, offering a comprehensive tool for traders.
Relative Strength Index (RSI)
A reliable momentum oscillator, the Relative Strength Index (RSI), offers valuable insights into the speed and magnitude of price movements. Oscillating between 0 and 100, this indicator assists traders in identifying overbought or oversold conditions, crucial for strategic entry and exit points.
Traders typically interpret RSI values above 70 as indicative of an overbought asset, suggesting a possible price reversal or correction. Conversely, values below 30 imply oversold conditions, potentially signaling a future price rise. The standard observation period for RSI is 14 days, but traders can adjust this to better suit different market scenarios and personal trading strategies.
Bollinger Bands
Created by financial analyst John Bollinger, Bollinger Bands offer a dynamic adaptive range based on market volatility. Consisting of a middle band (a simple moving average) and two outer bands (standard deviations away from the middle), these bands expand and contract according to market volatility.
Stochastic Oscillator
Another powerful tool for traders is the Stochastic Oscillator, a momentum indicator that compares a security’s closing price to its price range over a specified time. Like the RSI, it ranges from 0 to 100. Readings above 80 suggest an overbought condition, likely warranting closer scrutiny for reversals or corrections, while those below 20 indicate the potential for an oversold status, aligning with potential upward price movements.
Traders often use the stochastic oscillator together with the RSI for enhanced confirmation of potential price action signals. The integration of these indicators allows traders to make more nuanced and nuanced forecasts about asset price movements.
Comprehensive Strategy for Digital 100s Trading
While technical indicators provide invaluable assistance in digital 100s trading, forming a comprehensive strategy is essential. Having a strategy encompasses analyzing these indicators in conjunction, allowing traders to gain a holistic view of market conditions rather than relying on a single measure.
Combining Indicators
No singular indicator guarantees success in trading, making the combination of different technical indicators a crucial part of strategic trading. Each indicator provides unique insights, and leveraging a combination increases accuracy in predicting price movements. For instance, using Bollinger Bands to assess volatility alongside the RSI provides clarity on whether prices are overextended.
Importance of Continuous Learning and Practice
Trading, particularly in the fast-paced digital 100s environment, demands continuous learning and practice. Markets are ever-evolving, and staying informed about new techniques, indicators, and trends is crucial to maintaining a competitive edge. Educational platforms, online courses, and real-time analysis from credible sources such as trading education portals or financial news services offer valuable avenues to enhance knowledge and skills.
For those stepping into digital 100s trading, taking advantage of tutorials, comprehensive guides, and simulated trading accounts can provide hands-on experience without the risk, building confidence and competence.
In conclusion, while the indicators discussed provide foundational tools for traders, the broader journey in digital 100s trading requires dedication to learning and continuous refinement of strategies. Integrating technical analysis with sound risk management and strategic planning can significantly contribute to success in this dynamic trading landscape.
This article was last updated on: June 29, 2025